1. Overview of Component Model
Every visualization created using Mascot can be described as the composition of four types of semantic components: visual element, layout, encoding & scale, and relational constraint.
Visual Element
Mascot.js provides abstractions for the following types of visual elements, starting from the lowest level of the scene graph hierarchy:
Mark: basic graphical element in a visualization. A mark can be a geometric shape (e.g., circle, polygon), a text element, or an image (e.g., an icon).
Collection: a group of visual objects, each representing a data item. For example, in Figure 1(a), we have a bar chart, where the main content is a collection of twelve rectangle marks. Each rectangle represents a month.
Glyph: a group of marks where all the marks inside the glyph represent the same item. In Figure 1(b), we have a box plot, where the main content is a collection of five glyphs. Each glyph consists of multiple marks (i.e., a rectangle and lines), and all the marks in each glyph depicting different attributes (e.g., max, min, 75th percentile) of the same data item (a pay grade)
Reference Element: examples include axes and legends providing contextual information on how to read a visualization, and gridlines that facilitate reading and estimating data values in a visualization.
Scene: a self-contained view consisting of mark/glyph collections and reference elements like axes and legend.
Figure 1(c) shows how these visual elements are organized in a visualization. Note that a collection can be nested, e.g., the children of a collection are also collections.
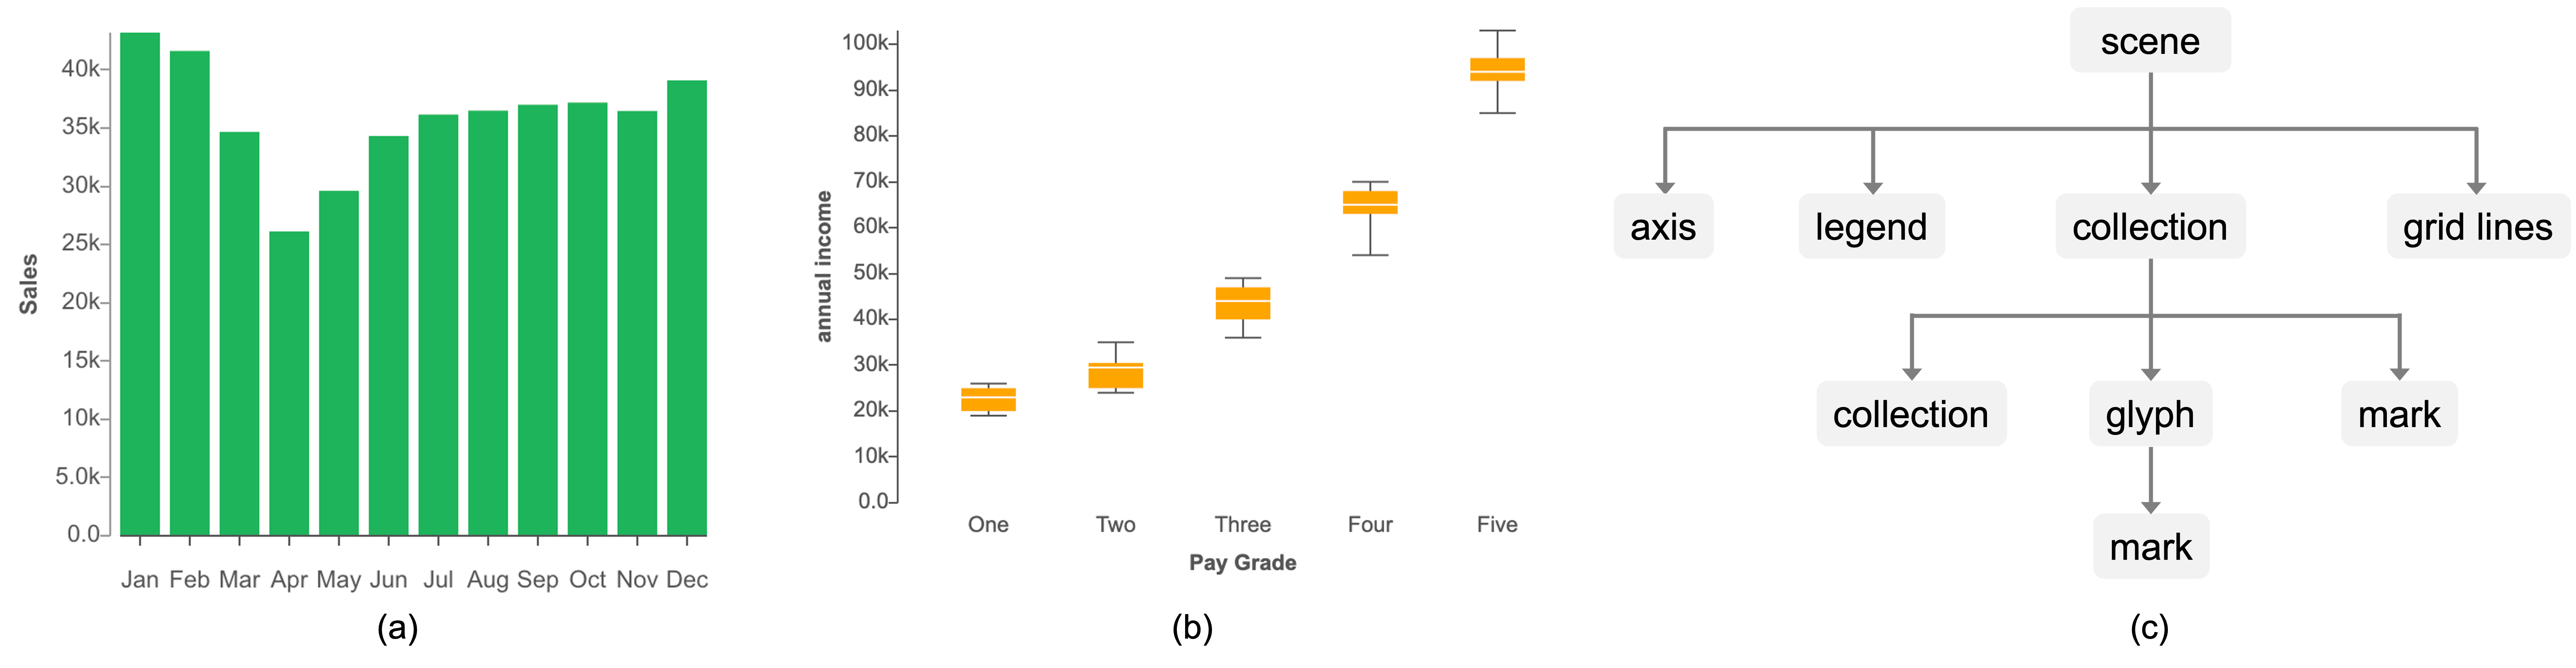
Figure 1: (a) bar chart as a collection of bars, (b) glyphs in a box-and-whiskers plot, (c) object hierarchy
Algorithmic Layout
The positions of visual elements in a collection are often determined by algorithmic layouts. For example, we can consider the rectangles in Figure 1(a) as laid out in a grid from left to right. Mascot currently supports four types of layout: grid, stack, packing, and treemap. Each layout has a number of parameters whose values can be adjusted.
Encoding & Scale
A visual encoding specifies the mapping between a visual channel and a data attribute. For example, In Figure 1(a), the height (visual channel) of each rectangle encodes sales value. Related to encoding is the scale component, which specifies how the data values map to the properties of a visual channel.
Relational Constraint
Constraints are requirements on the relative spatial arrangements of visual objects. For example, we can align visual objects to the left, or specify that the top left corner of a rectangle should always be 5 pixels apart from the bottom right corner of a text element.
Example: Semantic Components in a Diverging Bar Chart
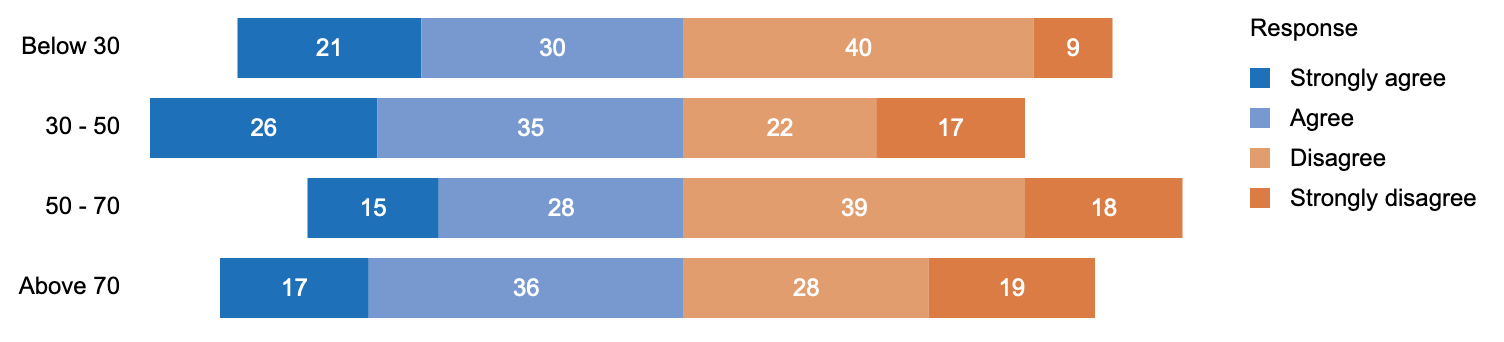
In the diverging bar chart above, we have four top-level visual elements in the scene: a legend, an axis with labels only, a collection of text elements, and a nested collection of rectangle marks. Inside the last collection, there are four collections of rectangles, each collection representing an age group and consisting of four rectangles.
The nested collection uses two algorithmic layouts: a grid layout placing the rectangle collections in four rows with 10px gaps between them, and a stack layout within each collection of rectangles.
There are three visual encodings in this chart: the width of each rectangle encodes the percentage values, and the fill color encodes the response type. In addition, the content of each text element encodes the percentage values.
Finally, the chart includes two constraints: the light blue rectangles are aligned to the right to better show the divergence of opinions, and the text elements are affixed to the center of the rectangles.
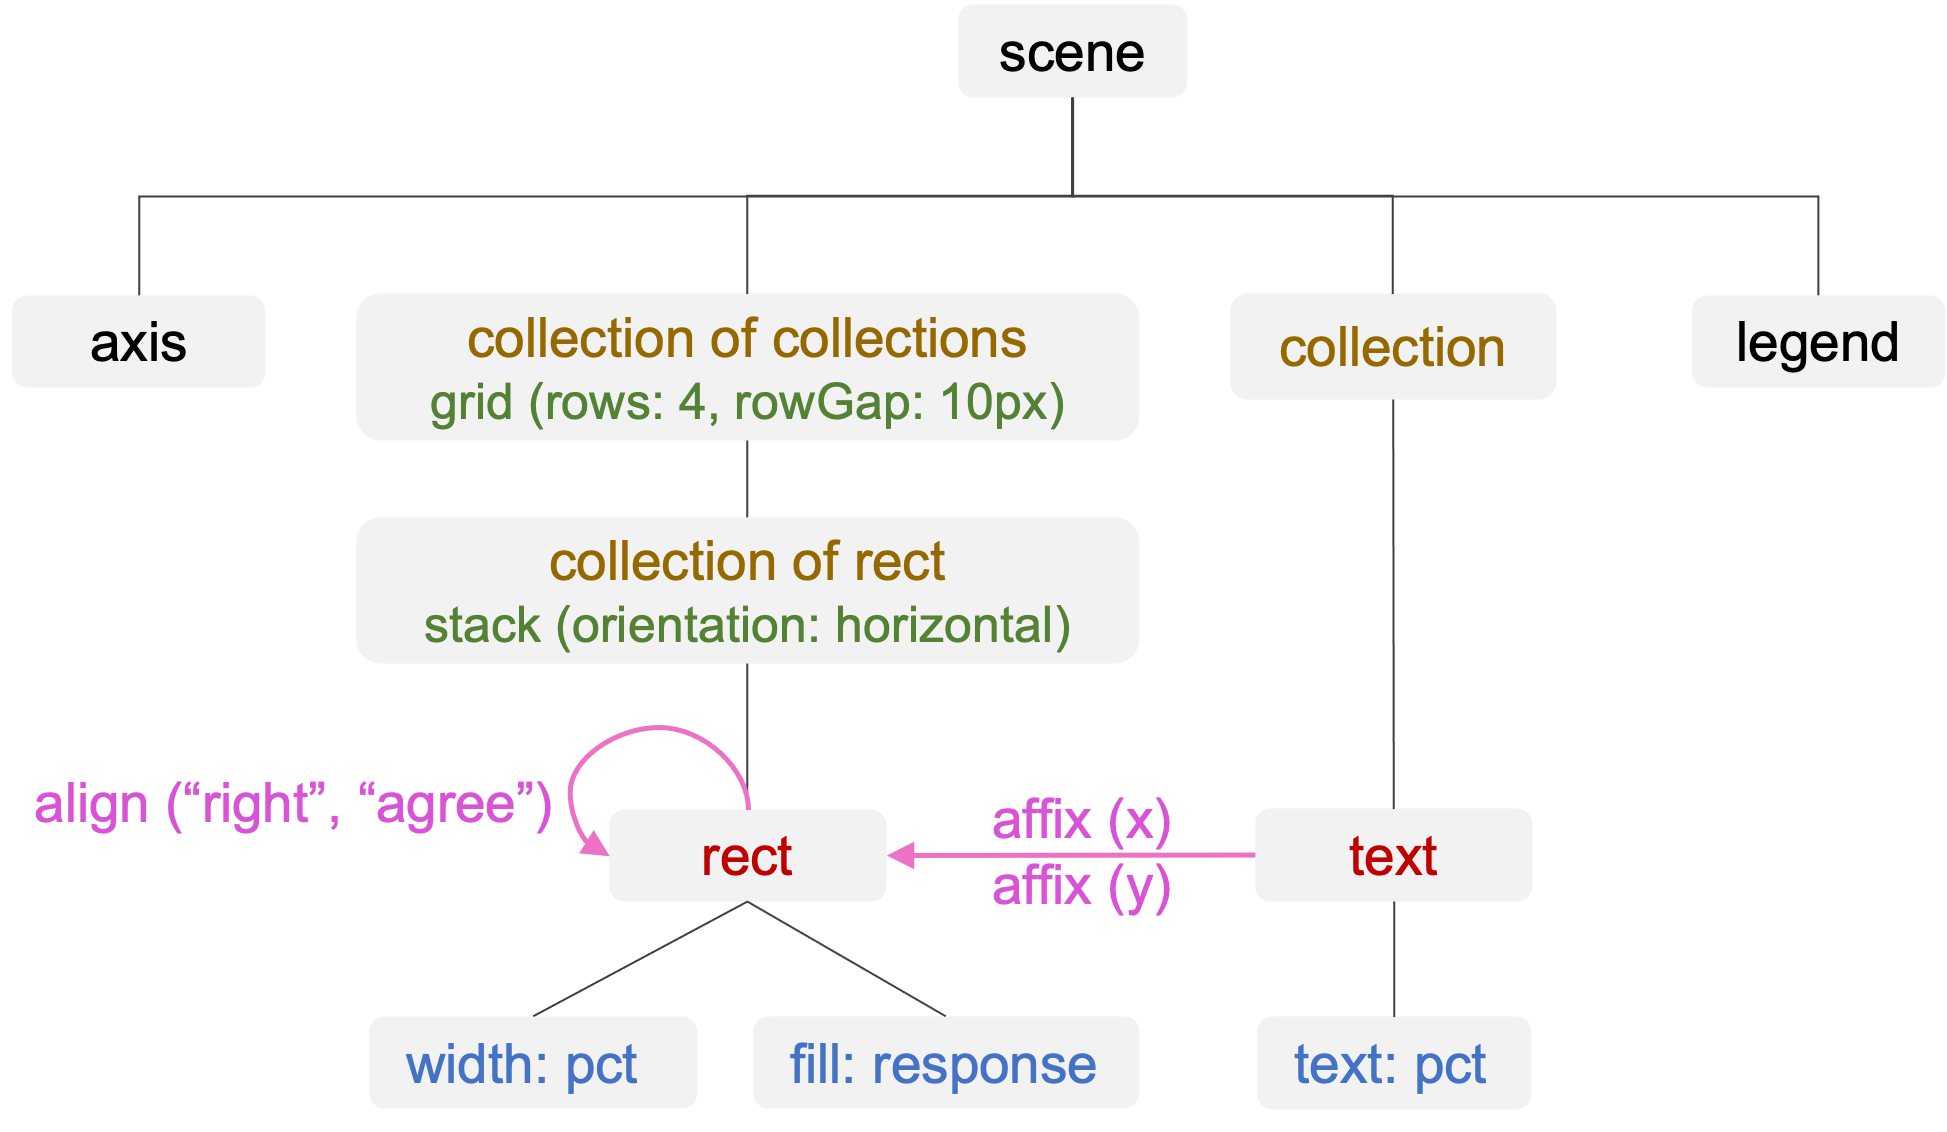
Figure 2: Semantic Components of a Diverging Bar Chart
In the following sections of the tutorial, we discuss how to create and manipulate these semantic components using the operations provided by Mascot.